
Home/Risk coverage/Cyber risk quantification
What we solve
Cyber risk quantification
Cyber exposure expressed in dollars, using Open FAIR — so a control investment can be argued against the loss it removes, and a risk acceptance can be signed by someone who understood what they were accepting.
- METHOD
- Open FAIR taxonomy, end to end
- OUTPUT
- Loss exceedance curve in USD, with assumptions on the record
- BUILT FOR
- The CRO, the CFO, the CISO and the board
FALCONRY360 IN PRACTICE
See the operating layer behind the service.
The platform gives the client a current view of the work, not only an end-of-month report. Scope, owners, evidence and actions remain visible between service reviews.
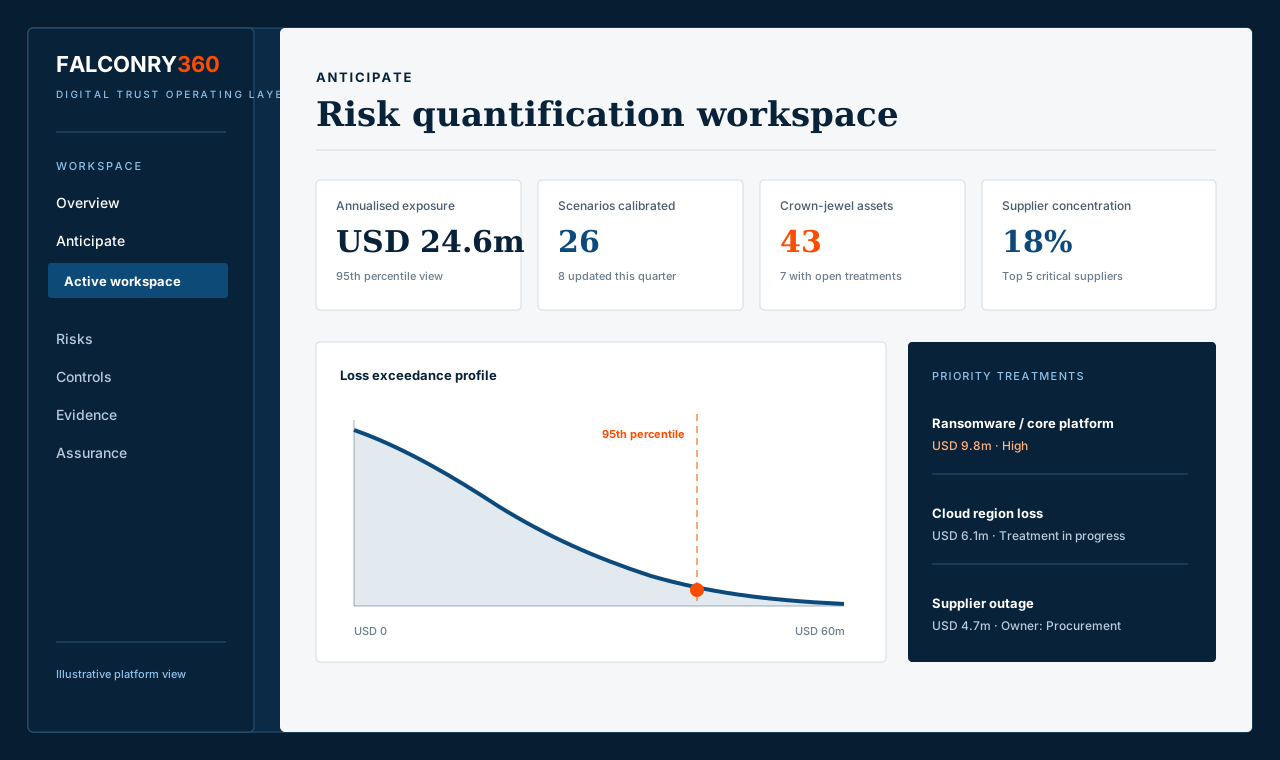 Illustrative platform view
The problem with the heat map
A heat map cannot be compared with a budget request. A loss distribution can.
Almost every cyber risk register in this region is scored on a five-point scale. Those scores cannot be added, cannot be compared across categories, and cannot be set against a number in a budget. So the register is presented, the board nods, and the investment decision is made on instinct or on whoever argued hardest.
The failure is structural, not cosmetic. Ordinal scores are labels, not quantities. Two amber risks do not make a red one. A risk that moved from 3 to 4 has not doubled. And when a CRO is asked to aggregate cyber with credit, market and operational risk — all of which are already measured in currency — cyber is the one that cannot join the conversation.
How Open FAIR decomposes it
Risk is broken down until what remains is something a person who knows the estate can actually estimate. Nobody can sensibly answer "what is our ransomware risk". Most people can answer "how many credential-phishing attempts reach a privileged user in a year".
How a scenario is built
Six steps, run as working sessions with your people rather than as a modelling exercise done to you.
Scope the scenario
A specific asset, a specific threat, a specific effect. "Ransomware on the core banking platform causing seven days of degraded service", not "cyber risk".
Calibrate the estimators
The people giving estimates are trained to give ranges they are 90% confident in. Calibration training measurably reduces overconfidence, and it is the step most implementations skip.
Estimate the factors
Minimum, most likely and maximum for each bottom factor, with the evidence behind each recorded — incident history, control test results, sector loss data, supplier disclosures.
Run the simulation
Monte Carlo across the distributions, typically tens of thousands of iterations, producing a full range of annual loss outcomes rather than a single number.
Review and challenge
Results returned to the estimators. Where the output looks wrong, the assumption behind it is visible and can be argued with — which is the point.
Maintain it
Scenarios are re-run when controls change, incidents occur or the estate moves. A quantification done once is a slide; done continuously it is a management tool.
What comes out
A loss exceedance curve: the probability of losing more than a given amount in a year.
How a board reads it
Left to right is money. Bottom to top is probability. The curve answers the two questions a board actually asks: how bad could it get, and how likely is that.
How it changes the decision
A proposed control moves the curve. The value of the investment is the area between the two curves — expressed in dollars, over a stated period, with the assumptions open to challenge. That is an argument a CFO can engage with.
What it is used for
Quantification is not an end in itself. These are the decisions it exists to support.
- Control investment cases
- Spend argued against exposure removed rather than against a maturity score. Competing proposals compared on return, so the larger reduction wins rather than the better presentation.
- Risk acceptance
- A residual position stated in dollars, with the probability attached, so the person signing knows the size of what they are accepting. This is the single biggest improvement in governance quality most clients see.
- Appetite and tolerance
- Board appetite set as a monetary statement and decomposed into tolerances by service, asset class and risk type — measurable rather than aspirational.
- Board and committee reporting
- Cyber reported in the same currency as every other risk on the agenda, which is what allows it to be prioritised against them instead of beside them.
- Portfolio prioritisation
- Where the estate carries dozens of exposures, the ranking is by quantified loss rather than by severity score, which reliably reorders the list.
- Cyber insurance
- Limits and retentions tested against the modelled loss distribution, so cover is bought against exposure rather than against last year's premium.
- Third-party and concentration decisions
- Supplier and cloud concentration expressed as exposure, which turns an abstract dependency argument into a number.
- Regulatory and supervisory engagement
- Supervisors across the region increasingly expect risk to be evidenced rather than asserted. A documented method with visible assumptions is a stronger position than a colour.
- Transaction and portfolio oversight
- For sovereign funds and holding companies, a comparable exposure basis across portfolio companies that each run their own security function.
What you need to start
Less than most people assume. The blocker is usually ownership, not data.
- An asset picture. Not a perfect CMDB — the crown jewels, the services they support, and who owns them. The platform builds this as you go.
- Incident history. Whatever exists, however incomplete. Three years of tickets is more useful than nobody thinks.
- Control test results. Existing audit findings, assessment outputs and testing reports, which inform the vulnerability factor.
- Four to six people who know the estate. Calibrated estimators from security, technology, operations and the business. Not a consultant with a spreadsheet.
- A decision that needs making. Start with a scenario tied to a real question — an investment case, an acceptance, an insurance renewal. Modelling without a decision attached gets abandoned.
The scenario library
Maintained in the Global Libraries by sector, each arriving with its decomposition structure, parameter guidance and calibration notes — so you are tailoring rather than starting blank.
- Ransomware on a core platform
- Data exfiltration and notification
- Third-party processor failure
- Cloud region loss
- Insider data theft
- Business email compromise
- Payment fraud at scale
- OT disruption with safety consequence
- Regulatory examination failure
- Credential compromise of a privileged account
- Supply chain software compromise
- Prolonged availability loss of a customer service
How the libraries are maintained · Sector packs add their own scenarios
What quantification does not do
The risk is false precision. We would rather name it than discover it together.
- It does not produce a true number. It produces a defensible range built on stated assumptions. Anyone presenting a single figure to two decimal places has misunderstood the method.
- It does not remove judgement. It relocates judgement to the individual factors, where it can be examined, rather than leaving it buried in a score.
- It is not a substitute for control work. Quantification tells you where to spend. It does not implement anything.
- It does not suit every risk. Some exposures are better handled qualitatively, and we will say so rather than model something to justify the method.
- Garbage in still applies. Uncalibrated estimators produce confident nonsense. That is why calibration is a step, not a footnote.
FalconryX proposes scenario parameters from your incident history, asset criticality and comparable sector loss data, and flags where an estimate sits outside the range its evidence supports. The estimators decide. How it is governed.
How an engagement runs
- Weeks 1–2
- Scope the first two or three scenarios against decisions you actually need to make. Identify and calibrate the estimators. Pull what asset, incident and control data exists.
- Weeks 3–6
- Estimation workshops, simulation, review and challenge. First loss exceedance curves, with the assumptions documented against each factor.
- Weeks 7–10
- Translate into the decision: an investment case, an acceptance recommendation, an appetite statement or an insurance position. Board-ready narrative produced from the platform record.
- Ongoing
- Scenarios configured in the Anticipate pillar and maintained — re-run on control change, incident or estate change, either by your team or by us under managed services.
The Anticipate pillar in full · What this changes for the CRO · Running it as a managed service